



Financial markets are full of signals that can help traders understand what buyers and sellers are thinking. Among the many candlestick formations, the gravestone doji is one of the most talked-about reversal patterns. While no chart pattern guarantees future price movement, this formation often gives traders valuable clues about changing market sentiment.
Whether you trade stocks, cryptocurrencies, forex, commodities, or exchange-traded funds, understanding candlestick patterns can improve your technical analysis. Learning how this pattern works, when it appears, and how to confirm its signal can help you avoid emotional decisions and build a more disciplined trading strategy.
This guide explains everything in simple language, making it useful for beginners and experienced traders alike.
What Is a Gravestone Doji?
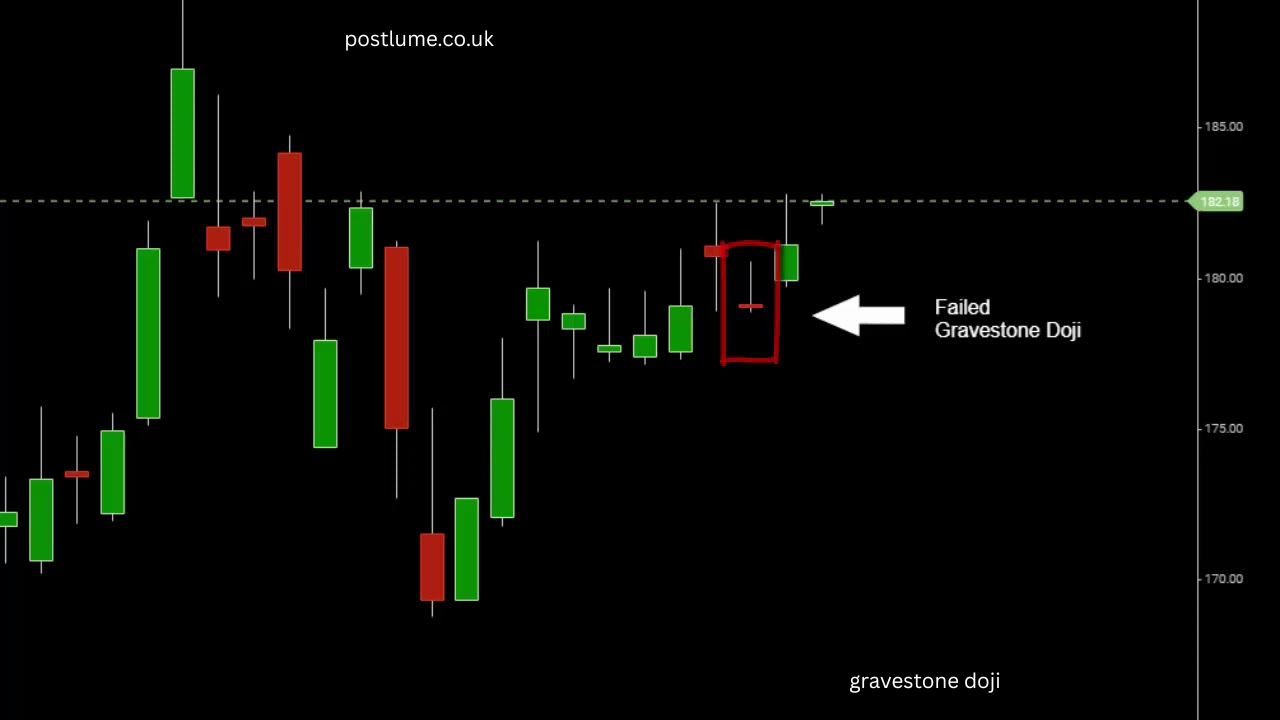
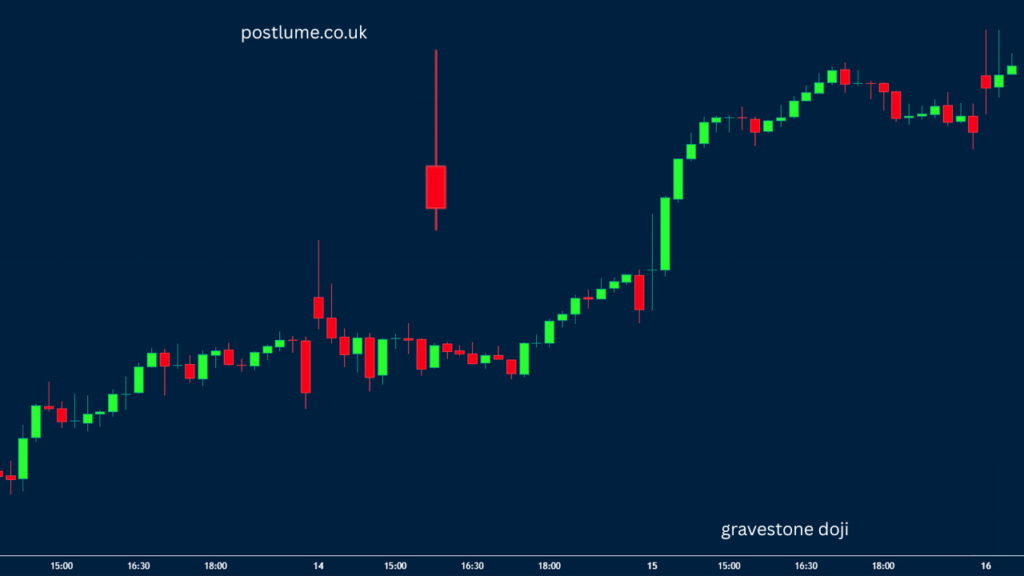
A gravestone doji is a candlestick pattern that forms when the opening price, closing price, and low are nearly the same, while the price reaches a much higher level during the trading session before falling back.
Visually, it looks like an upside-down “T.” The long upper shadow shows that buyers pushed prices higher, but sellers regained control before the session ended.
This price action tells an important story:
- Buyers started with confidence.
- The market rallied significantly.
- Sellers entered aggressively.
- The price returned close to where it began.
The result is a sign that bullish momentum may be weakening.
Understanding Candlestick Anatomy
Before interpreting any pattern, it’s helpful to understand the parts of a candlestick.
| Component | Meaning |
|---|---|
| Open | Price where trading began |
| Close | Final trading price |
| High | Highest price reached |
| Low | Lowest price reached |
| Body | Difference between open and close |
| Upper Shadow | Distance from body to session high |
| Lower Shadow | Distance from body to session low |
With this particular formation:
- The real body is extremely small.
- The upper wick is long.
- The lower wick is very short or absent.
This unique structure reflects a strong rejection of higher prices.
Why the Gravestone Doji Matters
Markets move because of the constant battle between buyers and sellers.
When buyers dominate, prices rise.
When sellers dominate, prices fall.
This candlestick reveals a session where buyers initially appeared strong but eventually lost control. By the close, nearly all buying gains disappeared.
For many traders, this represents a possible shift in market psychology.
However, the pattern should never be viewed in isolation. Successful technical analysis combines multiple indicators before making trading decisions.
How to Identify a Gravestone Doji
Recognizing the pattern becomes easier with practice.
Look for these characteristics:
- Very small or nonexistent real body
- Long upper shadow
- Almost no lower shadow
- Appears after a noticeable upward trend
- Higher trading activity often strengthens the signal
Charting platforms automatically display candlestick charts, making these formations relatively easy to spot.
Zooming out to examine the broader trend also helps prevent false interpretations.
What the Pattern Tells Traders
Buyer Exhaustion
During the session, buyers successfully pushed prices upward.
This suggested strong demand.
Unfortunately for them, the momentum did not last.
Seller Strength
Sellers entered the market with enough volume to erase nearly all of the gains.
That sudden reversal demonstrates increasing selling pressure.
Possible Trend Reversal
If confirmed by later candles, the pattern may signal that an uptrend is losing momentum.
Confirmation is critical because many markets produce temporary reversals that quickly disappear.
Confirmation Is Essential
One of the biggest mistakes beginners make is trading immediately after spotting a single candlestick.
Professional traders typically wait for confirmation.
Common confirmation signals include:
- A bearish candle forms next
- Price breaks below nearby support
- Higher-than-average trading volume
- Bearish momentum indicators
- Negative crossover in moving averages
Without confirmation, the market could simply continue moving upward.
Patience often reduces unnecessary losses.
Where This Pattern Appears Most Often
This formation works across nearly every liquid financial market.
Stock Market
Investors frequently use candlestick analysis to identify possible reversals in individual stocks and market indexes.
Cryptocurrency
Digital asset markets operate around the clock, making candlestick analysis especially popular among crypto traders.
Forex
Currency traders often combine candlestick formations with support and resistance levels.
Commodities
Gold, silver, crude oil, and agricultural products regularly display recognizable reversal patterns.
Index Trading
Major indexes often generate these signals near important resistance zones.
Combining Technical Indicators for Better Accuracy
Experienced traders rarely depend on one indicator.
Instead, they combine several analytical tools.
Popular combinations include:
Relative Strength Index (RSI)
An overbought RSI combined with a bearish candlestick may increase confidence in a potential reversal.
Moving Averages
Price rejection near long-term moving averages can strengthen the setup.
MACD
Momentum shifts shown by MACD may support the candlestick signal.
Volume Analysis
Heavy volume suggests stronger participation from institutional traders.
Fibonacci Retracement
Reversal patterns appearing near major Fibonacci levels often receive greater attention.
Common Trading Strategy
Although every trader has a different style, a simple approach often follows these steps.
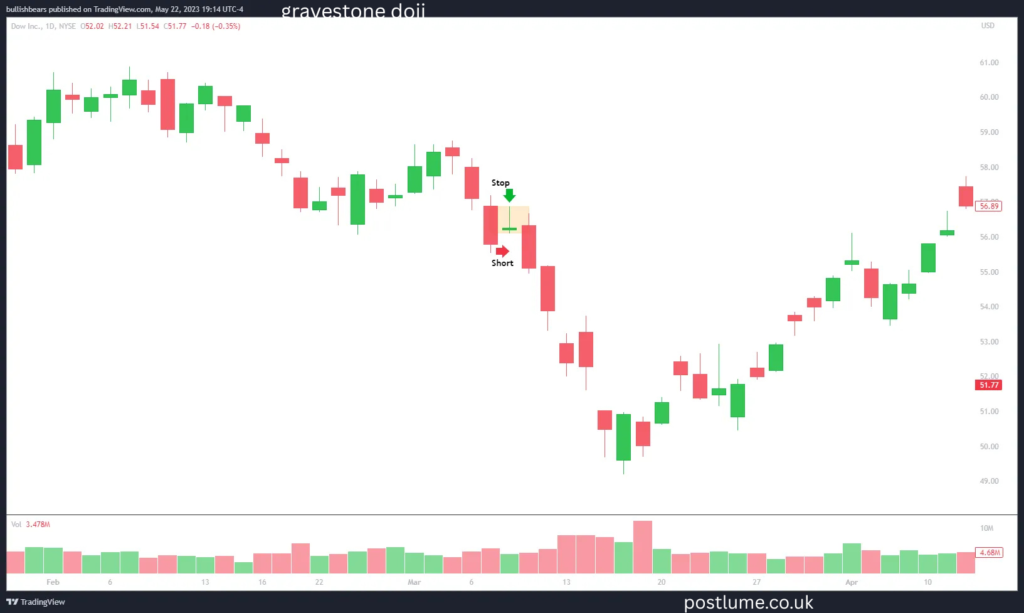
Step 1: Find an Uptrend
The market should already be moving higher.
Without an established trend, the pattern loses much of its significance.
Step 2: Spot the Formation
Look for the upside-down T shape with a long upper shadow.
Step 3: Wait for Confirmation
Allow the next candle to validate the signal.
Avoid rushing into a position.
Step 4: Plan Risk Management
Determine:
- Entry point
- Stop-loss level
- Profit target
- Position size
Proper planning helps control emotional decision-making.
Risk Management Always Comes First
Even strong chart patterns fail.
That is why successful traders focus more on managing losses than predicting every market move.
Good habits include:
- Using stop-loss orders
- Avoiding oversized positions
- Following a trading plan
- Maintaining realistic expectations
- Recording trades in a journal
Long-term consistency usually beats short-term excitement.
Common Mistakes Beginners Make
Many new traders misunderstand candlestick signals.
Some of the most frequent mistakes include:
- Trading without confirmation
- Ignoring the overall trend
- Forgetting volume analysis
- Overlooking major news events
- Risking too much on one trade
- Expecting perfect accuracy
- Chasing every reversal signal
Learning from these mistakes can significantly improve trading performance.
Why Traders Value This Pattern
Several factors explain its popularity.
Easy to Recognize
Its distinctive shape makes identification straightforward.
Works Across Markets
It appears in stocks, forex, cryptocurrencies, futures, and commodities.
Fits Many Strategies
Swing traders, day traders, and position traders all use candlestick analysis.
Supports Better Decision-Making
Combined with trend analysis and risk management, it offers another valuable piece of market information.
Benefits for Businesses and Professional Traders
Financial firms, investment advisors, proprietary trading companies, and educational platforms all benefit from understanding candlestick behavior.
Key advantages include:
- Improved market research
- Better timing for entries and exits
- Enhanced technical analysis
- More informed portfolio decisions
- Stronger client education
- Consistent chart interpretation
- Better trading discipline
Organizations that train analysts often include candlestick patterns as part of their educational curriculum because they remain relevant across multiple asset classes.
Key Features of This Candlestick Pattern
Some defining characteristics include:
- Small real body
- Long upper shadow
- Minimal lower shadow
- Indicates rejection of higher prices
- Often forms near resistance
- Signals weakening buying pressure
- Works on multiple timeframes
- Requires confirmation
- Supports broader technical analysis
- Useful with volume and momentum indicators
Each feature provides additional context rather than acting as a standalone prediction.
Why Choose Candlestick Analysis?
Candlestick charts remain one of the most widely used charting methods because they communicate a large amount of information quickly.
Benefits include:
- Easy visualization
- Better understanding of price action
- Suitable for beginners
- Effective across different markets
- Compatible with other indicators
- Helps identify market psychology
- Supports disciplined trading plans
Instead of relying solely on forecasts, traders can analyze what buyers and sellers have actually done.
That practical insight often proves more valuable than speculation.
Frequently Asked Questions About Gravestone Doji
Is a gravestone doji always bearish?
No. It suggests possible bearish momentum, but confirmation from later price action is necessary before making trading decisions.
Can beginners use the gravestone doji?
Yes. Beginners can learn to identify the pattern fairly quickly. However, they should practice using demo accounts and combine it with broader technical analysis.
Does this pattern work in cryptocurrency trading?
Yes. Many crypto traders monitor candlestick formations because digital asset markets produce frequent technical setups.
Which timeframe is best?
The pattern appears on nearly every timeframe. Longer timeframes, such as daily and weekly charts, generally provide more reliable signals than very short intervals.
Should I trade using only the gravestone doji?
No. It works best alongside trend analysis, support and resistance levels, momentum indicators, trading volume, and sound risk management.
Conclusion
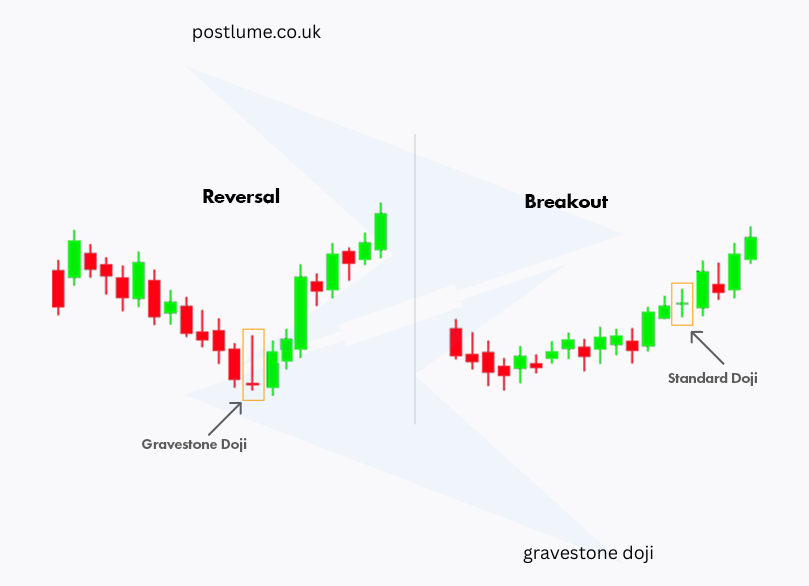
The gravestone doji is a valuable candlestick pattern that highlights a potential shift from buying strength to selling pressure. Although it often appears near the end of an uptrend, it should never be treated as a guaranteed reversal signal. Waiting for confirmation, studying overall market conditions, and combining multiple technical indicators can greatly improve decision-making.
Whether you trade stocks, forex, cryptocurrencies, commodities, or market indexes, developing a strong understanding of candlestick analysis can make your trading approach more disciplined and informed. Continue practicing on historical charts, refine your strategy, and always prioritize risk management over chasing quick profits. Consistent learning and careful analysis are far more valuable than relying on any single chart
